oomiay
The new standard for everyday jewelry — quality you can measure.
Consumers are buying mid-market jewelry blind.
- 01Marketing claims replace measurable standardsVibes over verifiable specs.
- 02Quality is hidden until after purchaseYou only learn the truth after wearing it.
- 03Key specs are rarely disclosedDurability becomes a surprise — not a choice.
We build trust in a trust-broken category — with quality you can measure.
Superior Quality
2.5 micron 18k gold plating, sterling silver, protective seal — ~5× the 0.5μm gold-plated benchmark.
Radical Transparency
Clear specs, honest education, and verifiable claims in a low-trust category.
Warranty-Backed Promise
Confidence → repeat purchases → customer loyalty.
The new standard for everyday jewelry.
Crafted for daily rotation
Premium materials, demi-fine techniques.
Distinctive silhouettes
Fresh modern shapes, design-led styles.
Radical transparency
Full specs always disclosed. Quality you can measure.
Unit economics that compound faster than competitors can catch up.
Tech-enabled growth engine.
Custom AI tool
In-house program generates realistic on-hand ring videos — no physical samples required.
Data-driven demand
Proven creative formats run rapid tests → capture pre-orders + waitlist intent.
Capital efficiency
Validates demand before manufacturing → inventory risk reduction, less dead stock + waste.
needed pre-test
& material waste
TTM Mar '25 – Feb '26 vs Mar '24 – Feb '25
- TTM Net Sales$2.9M
- Net Contribution Margin74.0%
- Product Margins84% – 92%
- Revenue per Employee$577K FY25
- CAC$67.64 / $81.71 ↓17.2%
- New customer AOV$91.32 / $81.93 ↑11.5%
- LTV$107.92 6mo · $111.66 12mo
- Contribution LTV$79.87 6mo · $82.64 12mo
- Payback (contribution)Month 1 vs $67.64 CAC
Near-breakeven TTM. Ready to scale.
Main drivers
De-risked scaling — capital fuels proven winners.
Inventory depth on repeat winners
Fewer stockouts, steadier delivery windows, higher conversion on winning ads.
Creator trust engine + whitelisting
Scalable creative pipeline + new discovery surfaces while lowering CAC.
Site + CRO upgrades
Higher PDP conversion + AOV optimization.
Reduce platform concentration risk.
Investment reduces single-channel dependence and builds a more durable growth engine.
Creator seeding + whitelisting — social proof that lifts CVR and lowers CAC.
Search (Shopping + non-brand) to harvest existing intent.
Lifecycle (email/SMS + PDP clarity) to convert more first-timers into repeat.
Raising $1–1.5M · Runway 15–18 months
Milestones (next 12–18 months)
- Scale to a $6–8M run rate.
- Maintain fast payback at scale — contribution payback ≤ 30 days.
- Reduce Meta concentration — creator/earned media + search as meaningful channels.
- Improve first-order economics — stronger PDP, bundles, CRO for higher CVR.
- Unlock constrained demand — inventory depth on proven SKUs, support preorders.
- Growth (creator / whitelisting / seeding)~50%
- Inventory depth~20%
- Site / CRO~15%
- SEM / SEO~10%
- Working capital~5%
Operators who've done this before.
Chief Operating Officer
Paid acquisition · Full-stack ops · Finance
ex-Nutribullet — developed new digital paid acquisition channels overseeing $10M in ad spend.
Chief Executive Officer
Content · Social · Branding · Jewelry design + buying
ex-IPG Mediabrands — strategized $105M in cross-channel spend.
Chief Technology Officer
Email/text · Loyalty · Site dev
Increased a $50M DTC brand email rev +125%, open rates +40%, click rates +2.3%.
Why invest?
A growing, branded jewelry market.
-
~22%CAGR — online jewelry (2024–2029)
-
8.3%Branded jewelry growth/year (2021–2024) — doubling unbranded growth.
Sources: Technavio (online jewelry market size), McKinsey State of Fashion 2026, US Census, Bespoke Intel, Plumb Club, Statsig.
Methodology, unit economics, and risk detail.
Definitions + data basis
-
Primary window
Apr '25–Feb '26 vs Apr '24–Feb '25 (used for CAC / AOV / payback comparisons unless otherwise noted).
-
Blended CAC
Total paid acquisition spend ÷ new customers (blended across paid channels; window-matched).
-
New customer AOV
First-order net sales ÷ new customers (window-matched).
-
Contribution LTV + payback
Incremental maturity-weighted nowcast averages monthly revenue increments across cohorts → converted to contribution using window contribution margin. Payback = first month where cumulative contribution ≥ CAC.
-
Sources
Finaloop (P&L + contribution), Shopify (orders + item costs), Polar (cohort exports), ad platforms / spend tracker (paid spend).
Net sales = "Net Sales" per Finaloop/Shopify reporting; treatment of discounts/refunds/taxes/shipping follows tool definitions and is applied consistently. Paid spend = paid media spend tracked in your blended CAC report; applied consistently across both windows. Nowcast averages monthly revenue increments across cohorts with observed data; eliminates composition bias from high-AOV cohorts rotating out of a level average. Tail (Mo 10–12) uses 2024 observed increments × 0.7 shrinkage factor. Dec '25 / Jan '26 Month 1 down-weighted due to preorder fulfillment delay. Payback = first month with cumulative contribution LTV ≥ CAC. Product gross margin: Shopify item price vs item cost (incl. tariffs in cost), excludes fulfillment/processing/marketing.
Competitive look-alike
Demi-fine / vermeil / sterling silver. Many DTC collections converge on near-identical minimal staples (basic bands, similar chains). Oomiay's edge: sculptural forms, 2.5 micron plating, warranty-backed quality.
How we estimate contribution LTV (maturity-weighted nowcast)
-
1
Start with observed cohorts
Use Apr '25–Feb '26 cohort curves where available.
-
2
Incremental averaging
For each month, compute the weighted average revenue increment across cohorts with observed data for that transition — rather than averaging cumulative levels. Eliminates composition bias when cohorts of different first-order sizes rotate in and out of the average.
-
3
Extend conservatively
Apply 2024 observed increments × 0.7 shrinkage factor for months beyond observed data (months 10–12).
-
4
Convert to contribution + payback
Revenue curve × 74.0% net contribution margin → payback = first month cumulative contribution ≥ window-matched CAC.
Payback on contribution
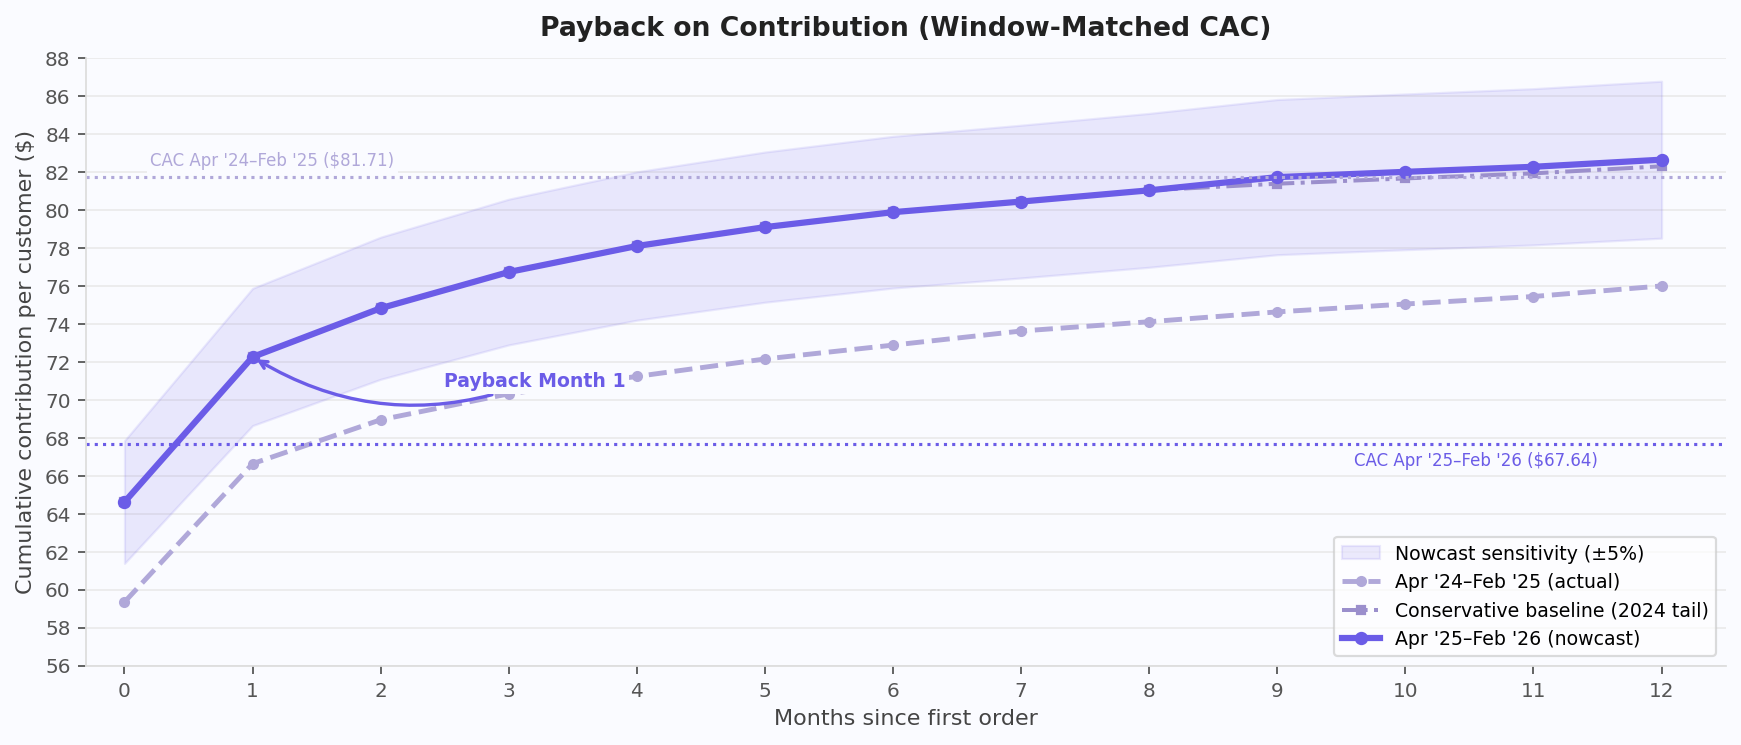
- Apr '25 – Feb '26 cohorts: contribution payback vs current CAC ($67.64) — Month 1.
- By Month 9, 2025 cohort contribution LTV ($81.72) surpasses the prior-year CAC benchmark.
Apr '25–Feb '26 windows are post-pivot. LTV: incremental maturity-weighted nowcast from Polar cohorts, 74.0% net contribution margin (Finaloop). Apr '24–Feb '25 baseline. Tail (Mo 10–12): 2024 observed increments × 0.7 shrinkage. Payback = first month cumulative contribution ≥ window-matched CAC.
CAC + new customer AOV (monthly, window-matched)
- Blended CAC (Apr–Feb): $67.64 vs $81.71 −17.2%
- New customer AOV (Apr–Feb): $91.32 vs $81.93 +11.5%
- Monthly table shows the improvement is broad-based, not a single-month artifact.
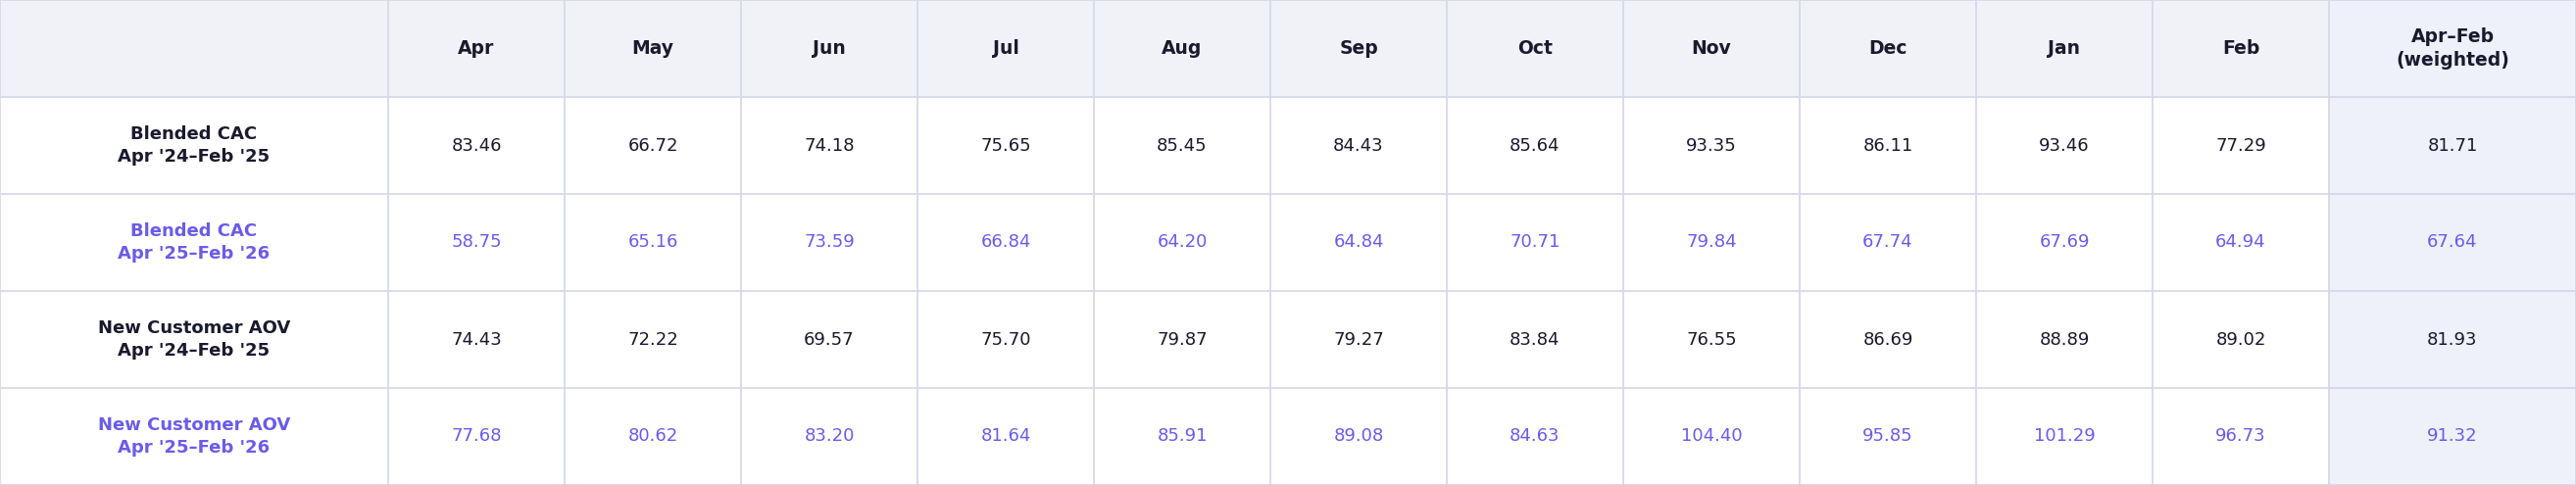
Window: Apr '25–Feb '26 vs Apr '24–Feb '25 (window-matched). Blended CAC = total paid spend ÷ new customers ('24: $1.92M / 23,498; '25: $1.45M / 21,425). New customer AOV = new customer sales ÷ new customers (first order; from Customer Metrics export). Weighted average column is the window summary used in the core deck.
High product margins that stay durable as input costs move
- Core demi-fine assortment: ~88%–93% product gross margin (IQR) (Shopify item costs incl. tariffs).
- Hero example (stone-forward, labor-intensive): Star Tennis Necklace ~86%–87% product gross margin.
- Recent silver cost increases are reflected in newer pricing architecture; margins remain protected.
- Product-level economics support fast contribution payback (see A4).
Product gross margin (Shopify): (item price − item cost) ÷ item price; item cost includes tariffs when embedded in Shopify cost inputs. Excludes fulfillment/shipping, payment processing, and marketing (product-level GM, not contribution). "Star Tennis Necklace" shown as a representative SKU example; SKU-level margins vary by component mix.
Financial history + accounting basis
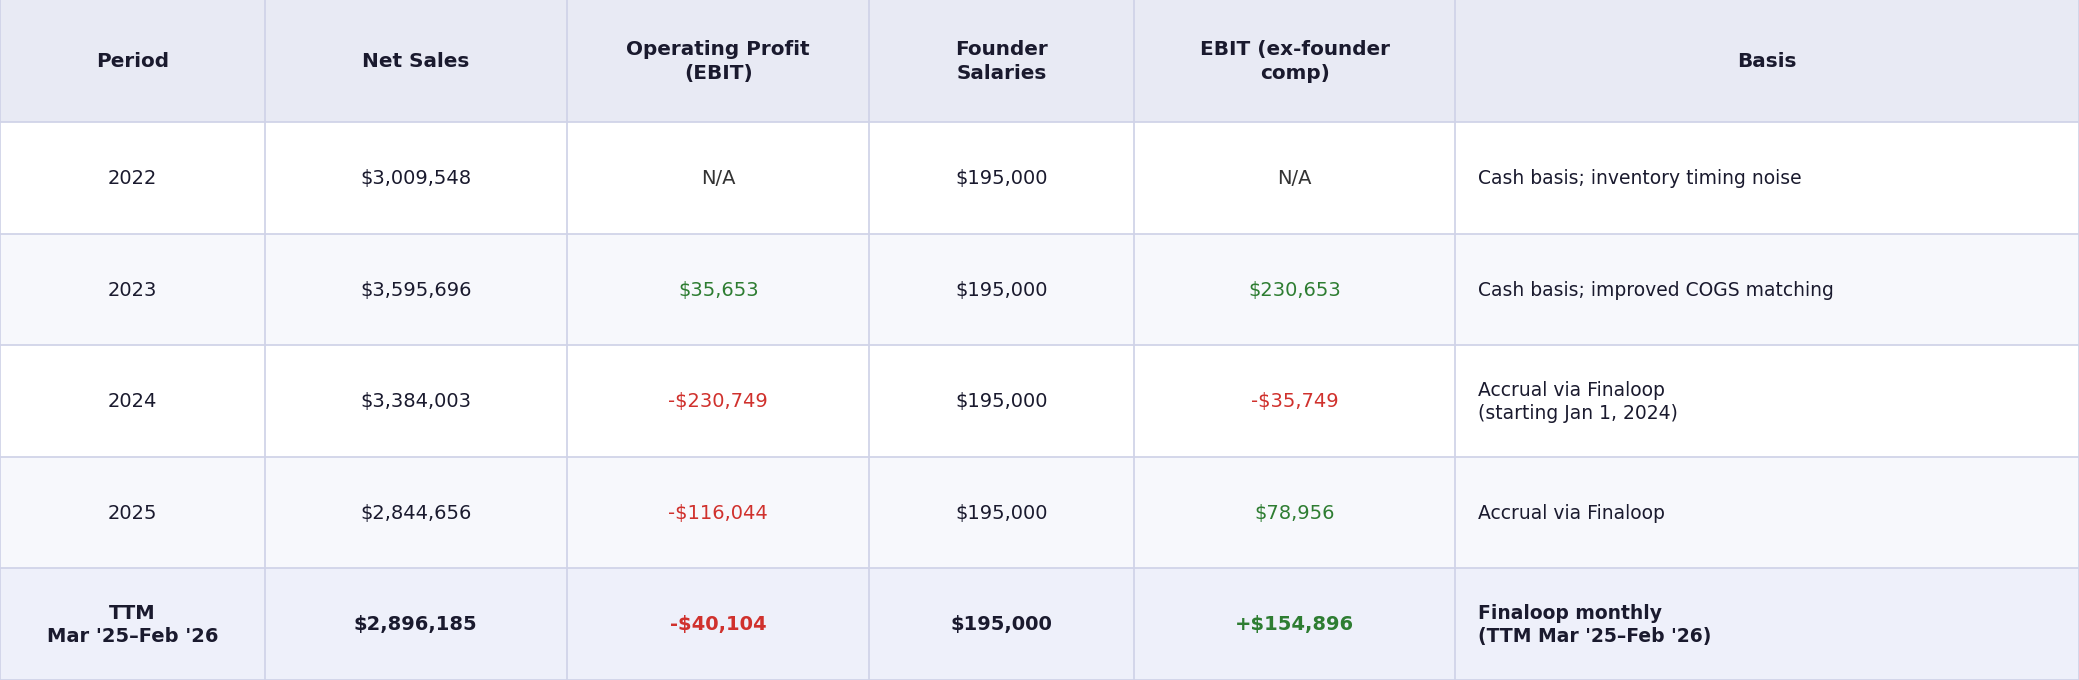
- 2024+ is accrual via Finaloop (consistent basis starting Jan 1, 2024).
- Starting mid-March '25: deliberate reset — tightened catalog, cleared legacy inventory, rolled out quality upgrades across the core assortment.
- TTM (Mar '25–Feb '26): near-breakeven (−$40K EBIT, −1.4% margin) and +$155K EBIT ex-founder comp (+5.3% margin).
- TTM EBIT improved +$315K vs prior TTM (Mar '24–Feb '25 = −$355K, −11.8% margin).
2022–2023 are cash basis; 2024+ is accrual via Finaloop. EBIT ex-founder comp adds back $195K annual total founder comp — three full-time operator-founders at $65K each. TTM = Mar '25–Feb '26. Mar '25 includes intentional catalog reset and inventory clearance.
SKU focus + inventory discipline
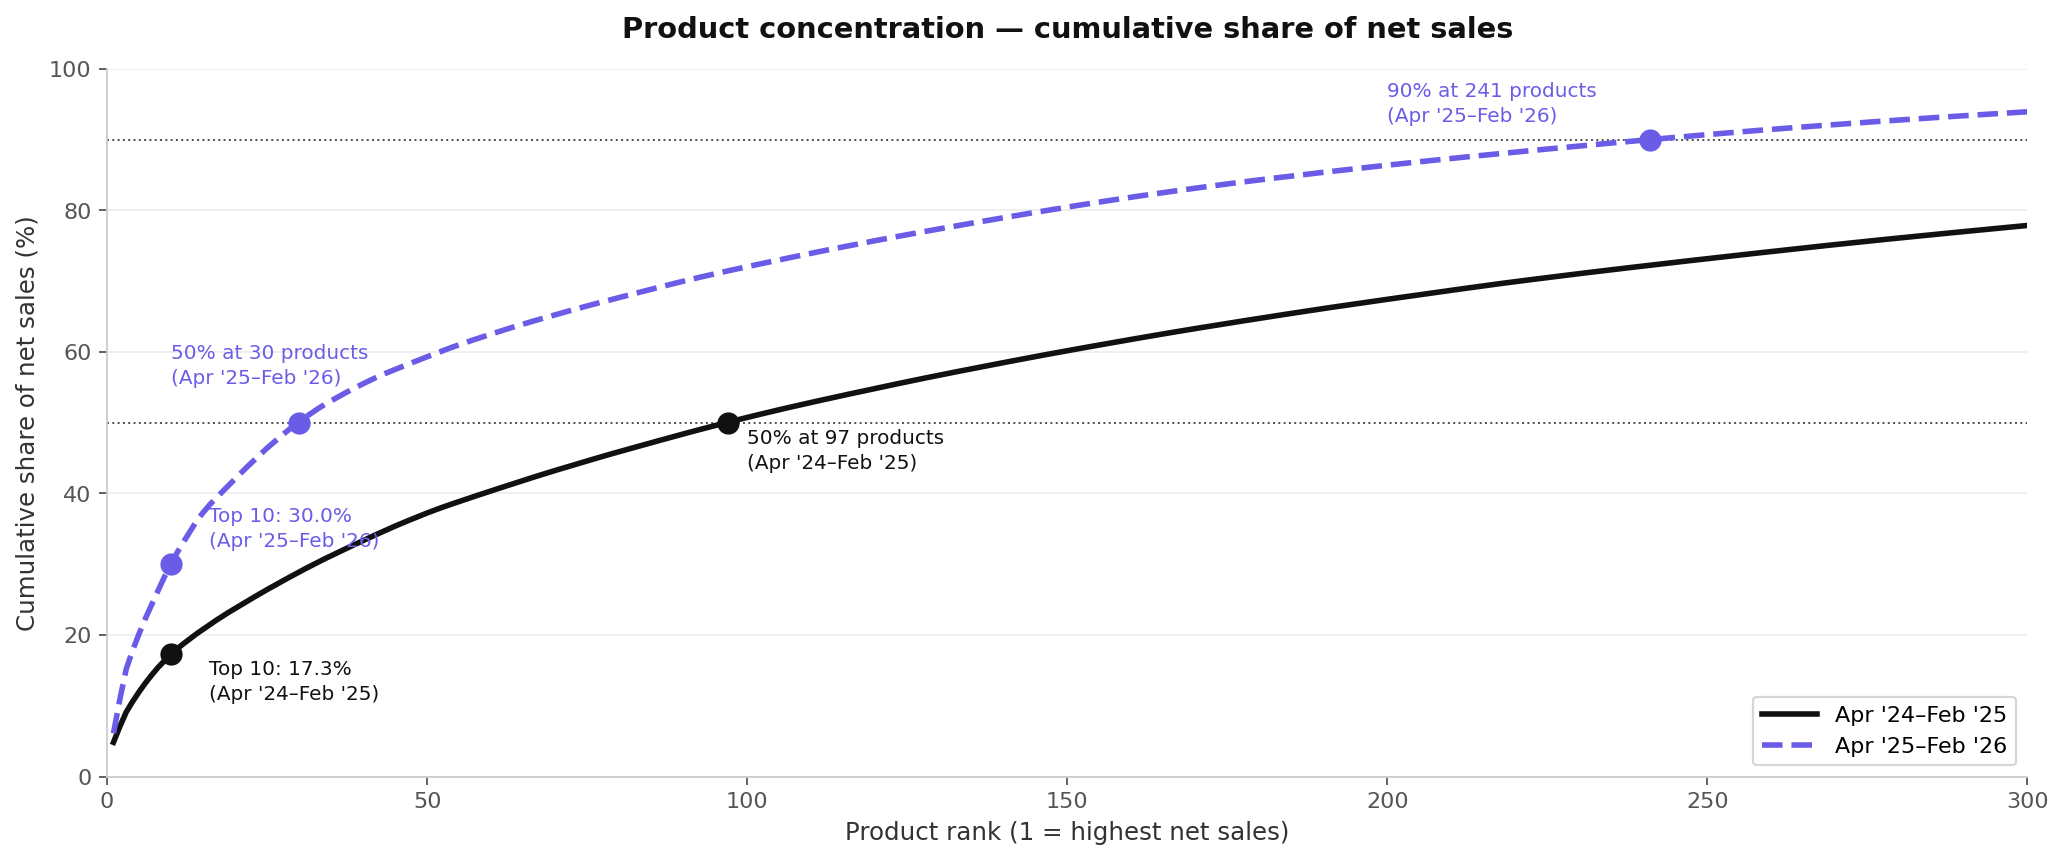
- Concentration increased post-reset: Top 10 = 30% of net sales (vs 17% in prior year).
- Fewer "winners" drive the business: 50% of net sales from 30 products (vs 97 in prior year).
- Enables deeper buys on proven styles (fewer long-tail bets) → lower aged inventory risk + more predictable working capital.
Net sales by product, Apr '25–Feb '26 vs Apr '24–Feb '25. Products ranked by net sales; chart shows cumulative share of net sales by product rank. Post-reset refers to the mid-March '25 catalog reset; Apr–Feb window reflects the clean post-reset period.
Key risks + mitigations
-
Channel concentration / CAC volatility
Diversify acquisition (search, creators / affiliate), strengthen email + SMS capture, scale only on payback discipline.
-
Category commoditization ("pretty jewelry" look-alikes)
Differentiate through distinct silhouettes + measurable quality (hand-set stones, 2.5μ plating, protective seal) + warranty-backed trust; focus on hero SKUs that drive repeat.
-
Input cost volatility (silver / logistics)
Price architecture + spec-driven value; maintain margin targets with planned updates (not promo reliance).
-
Inventory / working capital risk
Tight SKU focus + depth on proven winners; conservative buys tied to sell-through and lead times.
-
Quality / returns risk as volume scales
Standardized QC, supplier controls, and tracking defect / return drivers by SKU.